Understanding CFS Fishing: What It Means for Anglers

If you’ve ever checked a river report before heading out to fish, you’ve probably seen a number listed as CFS, or Cubic Feet per Second. CFS is a crucial water measurement that indicates the flow rate of a river. But what does it actually mean? And more importantly, how does it impact your day on the water?
Let’s break it down.
What is CFS (cubic feet per second)?
CFS stands for Cubic Feet per Second — it’s a measurement of volume flow rate. As a water measurement, CFS helps quantify the volume of water moving through a river or stream at any given time. One cubic foot is about the size of a basketball. So when a river is flowing at 300 CFS, that means 300 basketballs’ worth of water are moving past a given point every second.
This measurement gives anglers, boaters, and water managers a sense of how much water is moving through a river or stream. It’s measured by gauges maintained by organizations like the USGS, and you can find real-time readings for most major rivers online.
It’s important to note that CFS is river dependent and the rate at one river doesn’t always translate from one river to the next. Rivers in the same area that are all similar in size may be able to be referenced to each other on any given date, but it’s good practice to look at rivers in isolation comparing each river to itself. To help visualize this lets use an exaggerated example for 2 different rivers flowing at 1,500 CFS:
-
River 1 is 20’ wide: At 1,500 CFS this river is dangerously fast with an enormous amount of volume of water pumping through any given point on this small section of river each second.
-
River 2 is 200’ wide: At 1,500 CFS this river is a trickle with extremely low flows.
How is CFS flow rate measured?
Understanding Streamflow Measurement
The U.S. Geological Survey (USGS) employs a systematic approach to measure streamflow, which is the volume of water moving through a river or stream over time, commonly expressed in cubic feet per second (CFS). This systematic approach ensures precise water measurement, which is essential for various applications. A primary method involves using a mechanical current meter that rotates with the water’s flow. Hydrographers (professionals who study aquatic environments determining, depths, currents, or tides) position this meter at various points across a stream’s cross-section to record water velocity and depth. By dividing the stream into multiple vertical subsections and calculating the area and velocity for each, they determine the discharge for each segment. Summing these values provides the total streamflow at that location.
Beyond mechanical meters, the USGS utilizes advanced equipment to monitor streamflow. Stream gages, for instance, are installed alongside rivers to continuously record water levels, known as gage height or stage. These measurements are then converted into streamflow data using a site-specific stage-discharge rating curve, developed from on-site observations. This combination of traditional and modern techniques ensures accurate and reliable streamflow data, essential for water resource management, flood forecasting, ecological studies, and obviously most importantly fishing.
For a more in depth understanding of this you can read the USGS blog post here.
What Influences CFS?
Now that we have an understanding of what CFS is lets discuss what actually creates a change in CFS in a river. There are two primary factors that will influence CFS: Human and Natural influence
Both human and natural influences can significantly alter water measurement readings in a river.
Human Influence
A substantial portion of fishing rivers are tailwaters which are fisheries that are located below a dam. There are numerous benefits to tailwaters like consistent flows and more stable water temperatures throughout the course of the year but it this still plays a factor in the flows and specifically the fishing.
Flows (the amount of cubic feet per second) are increased whenever water is released from the dam. These changes in flow rates are critical for accurate water measurement and management.
Western Tailwaters
In western tailwaters these fluctuations in releases and flows can be less frequent compared to eastern tailwaters as we don’t get the quantity of rain (amongst other factors) that the rest of the country does and are heavily reliant on snowfall to fill our reservoirs after melting each spring. This sudden increase in water level in the reservoirs causes larger releases in the Spring so the reservoirs don’t overflow, but have enough water for the rest of the year. These seasonal changes are crucial for accurate water measurement and resource planning.
Here is a visual of that large spike in volume experienced each Spring compared to what it looks like on a weekly view where there are very little changes in flows below that.


Eastern Tailwaters
A lot of Eastern tailwaters have very consistent release schedules that are planned in a very structured way in the form of “generation schedules”. These generations are when water is release to generate electricity for the surrounding cities. Understanding these schedules is important to know so you don’t try and fish at the wrong time, but also so you aren’t in the water when the generations start as the water levels can rise in minutes and sometimes seconds. Most dam have a large horn that signals the release, but if you are too far downstream it may be hard to hear so it’s a great idea to have a point of reference and whenever you see sign of water increasing to head to the shore immediately. Understanding these schedules is essential for accurate water measurement and safe fishing practices.
Here is a generation schedule chart with the red box showing they will be generating electricity by increasing the flows from 6am to about 4pm with the highest water released from 8am - 2pm.

Natural Influence:
Freestone Rivers
A freestone river is a naturally flowing waterway, usually distinguished by a bed made up of rocks or gravel. These rivers are mainly sustained by snowmelt and rainfall, which causes their water levels to vary significantly, particularly during the spring runoff. Typically undammed, freestone rivers are recognized for their constantly shifting and dynamic nature. These natural variations are essential for accurate water measurement and understanding river dynamics.
Here is what the flows look like on a The Eagle River, a freestone river in Colorado.

Spring Creeks
Spring creek flows describe the movement of water in a distinct type of stream or river system. Rather than being fueled by precipitation or melting snow, these waterways are supplied by subterranean springs or aquifers. This leads to steady water levels, stable temperatures, and clear conditions year-round. The consistent flow in spring creeks makes water measurement more predictable and reliable.
Here are two spring creek graphs 1 in Pennsylvania and the other in California. Two very different locations in the country, but the graphs share a similar pattern of undulation.


Rain
The other primary factor that influences water level is rain regardless if you’re fishing a tailwater, freestone, or spring creek. As the rain comes it increases the volume of water in the river increasing the flows. This is particularly impactful on smaller streams and rivers as there is less surface area to spread the sudden increase in water which typically results in flooding. Rainfall significantly impacts water measurement, especially in smaller streams and rivers.
Here is a great visual on a small stream in Georgia after a large rainstorm. The Water Science School wrote “The chart below shows rainfall, in inches, during each 15-minute increment on Dec. 24th and the continuous measure of streamflow, in cubic feet per second (ft3/s). The brown line in the chart shows that streamflow is much higher during the flood period than just before it. The line shows that the baseflow was about 50 ft3/s before the river started to rise, but that just a few hours later, at 9:00 AM streamflow was over 6, 000 ft3/s - that is about 150 times the amount of water flowing by as during baseflow conditions.”

Why CFS Matters to Anglers
CFS affects everything from where fish hold, to how accessible the river is, to whether it’s even safe to be on the water. It’s a good idea to check the flow reports before you go out each time so you know what to expect while you’re there or if it’s even worth going out. This is especially true for those who have to drive a ways to fish and aren’t fortunate to live a short drive away from the river. Accurate water measurement helps anglers make informed decisions about when and where to fish.
Lets look at 4 primary ways CFS impacts our fishing:
1. Fish Behavior and Holding Spots
Temporary changes in CFS:
Temporary or sudden changes can turn fishing on or off for a couple hours or a couple days. If your river has been cruising at 300 cfs for months over the winter and suddenly shoots to 500 cfs the fishing will generally slow or turn off for a couple days until the fish get reacclimatized to the new flows.
If you’re out fishing and suddenly it starts nuking rain the sudden increase in flows can dislodge a lot of bug life and throw smaller bait fish from safety which can cause a feeding frenzy. A lot of my best days on the water are during these situations where fish will start feeding aggressively on both nymphs and streamers. The rain also helps provide a little security blanket for them enabling them to eat with less reservation and greater confidence.
Low(er) CFS:

Low CFS normally means slower, clearer water.
Fish become more cautious and spooky. They’ll tuck into deeper pools, undercut banks, or shaded areas looking for a safe place to rest. In these circumstances you need to be more tactical in your approach and presentation and the fish can more easily critique and see everything around them. Lower CFS readings emphasize the need for precise water measurement to understand fish behavior.
PSA: When it’s hot outside and the water levels are low the water temps elevate increasing the stress it puts on fish and the odds of them dying after release. Check out this article to learn more how water temps affect our trout.

High(er) CFS:
-
High CFS means faster, often muddier water.
-
Fish seek shelter from strong currents — behind rocks, in eddies, or close to the bank.
-
On high flows, bigger flies and heavier rigs are more effective to give you a little bit more horse power in the powerful currents.
-
Higher CFS readings require accurate water measurement to ensure safe and effective fishing.
2. River Accessibility
Some rivers are best fished or floated at a specific CFS range. Too low, and boats scrape bottom or become impassible in a drift boat. Too high, and wading becomes dangerous or impossible. For example, a river might fish best between 200–500 CFS. Under 200, it’s too bony for drift boats, but doable for an inflatable fishing boat. Over 500, it’s pushy and dangerous for wading.
Understanding your local rivers equivalent fishable range helps planning a float or deciding whether to bring waders or a raft. Accurate water measurement helps determine the best CFS range for fishing and boating.
3. Safety
High CFS often means higher risk. Swift water, debris, and limited eddies can turn a fun float into a hazardous situation — especially during spring runoff or after heavy rains. Accurate water measurement is crucial for assessing the safety of fishing conditions.
Wading anglers should always respect high flows. If you’re unsure whether it’s safe to cross, don’t. Even with safe, but elevated flows it’s smart to use a wading staff or a sturdy stick to cross so you have another point of contact helping you stay up right.
4. Trip Planning
When planning a big trip out west or just a new river a weekends trip away you’re going to want to look at historical reports to see if it makes sense to go or not. If there is always a large increase in flows for the month of May it’s probably not the best idea to plan a trip then and should look at a date before or after those high weeks.
Historical water measurement data can help plan the best times for fishing trips.
How to Check CFS
You can find real-time CFS data from a bunch of different sources, but they ultimately always pull from the USGS Water Data. These websites, apps, and local resources can just make it easier to read and determine if you should hit the water or the tying vise. These sources provide accurate water measurement data to help you decide when to fish.
-
Websites like River Reports
-
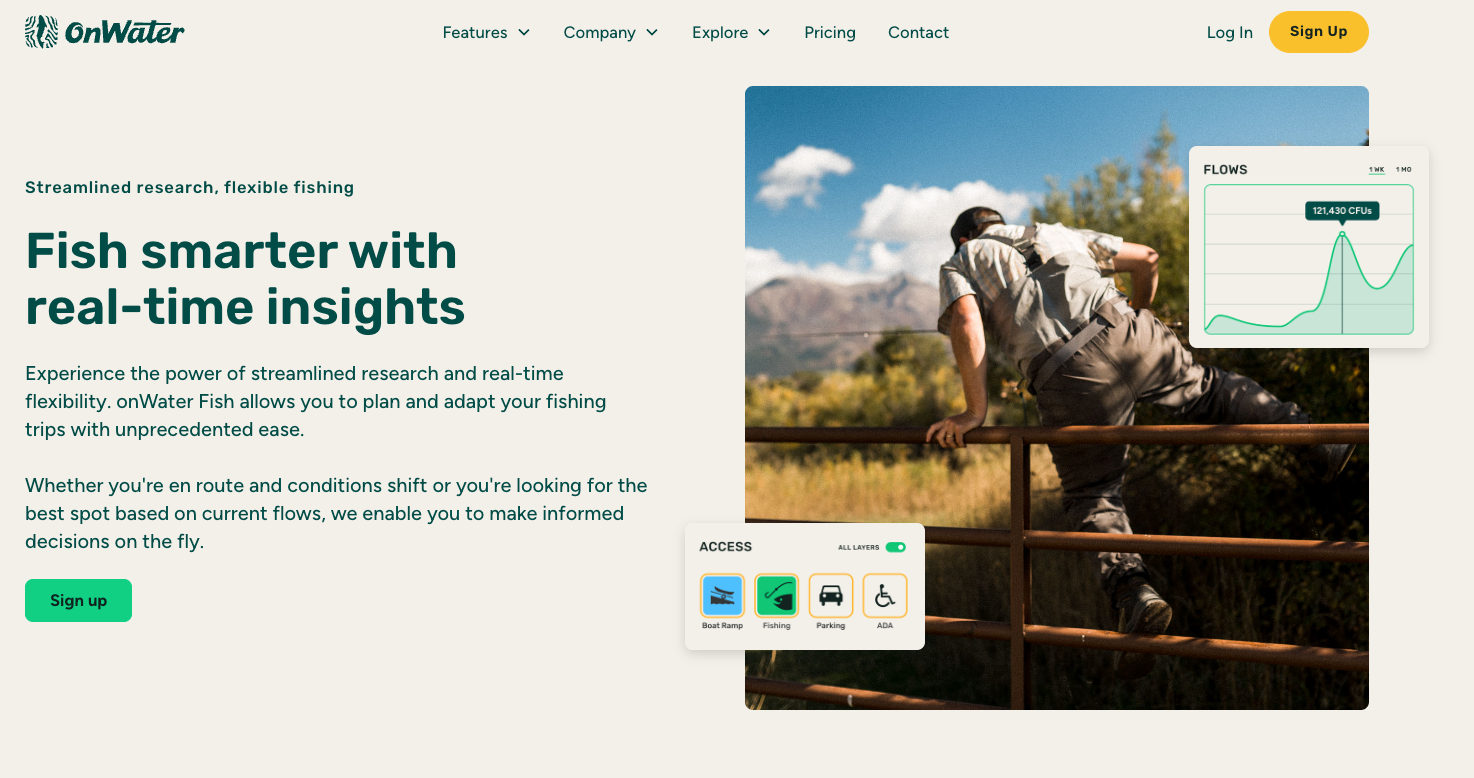
Fishing Apps: TroutRoutes, OnWater
-
TroutRoutes made this Youtube video on reading stream flows in the Trout Routes app as well
-
-
-
Local fly shops or organizations
-
Western Rivers Flyfisher here in SLC had a simple and easy to read river conditions report that can give anglers the answer they’re looking for at a quick glance
-
Fly Shops’ reports aren’t always up to date so you want to make sure the report you’re looking at is still relevant as flows can change at any given point in the course of a week. Most shops have links to the USGS data so it’s easy to check
-
-
Here’s a large fly fishing club in the St. Louis, Missouri area called Flyfishers at the Crossing that has a static page that helps give local anglers a point of reference to understanding their local reports.
Reading a CFS Graph
Understanding a CFS graph is crucial for planning your fishing trips. Here’s how to interpret one: Source: Florida Sportsman
-
X-Axis (Horizontal): Represents time, typically in days.
-
Y-Axis (Vertical): Represents flow rate in cubic feet per second.
-
Blue Line: Shows the actual flow rate over time.
Interpreting a CFS graph is essential for accurate water measurement and planning your fishing trips.
Key Observations:
-
A rising blue line suggests increasing flow, possibly due to recent rainfall or snowmelt.
-
A falling blue line indicates decreasing flow, which might mean clearer water and easier wading conditions.
By comparing the current flow (blue line) to the historical median, you can assess whether the river is experiencing typical conditions for that time of year.
Final Thoughts
CFS isn’t just a number — it’s a tool that helps you fish smarter, safer, and more effectively. Pay attention to it like you would weather or hatch reports, and you’ll start to recognize patterns that put more fish in your net.
Accurate water measurement is a key tool for successful and safe fishing.
Additional Resources:
If you’re interested in reading an entire book on fishing tailwaters Pat Dorsey wrote a great book that goes into depth on tailwater background, their impact, and tactics to fish throughout the year that I’d highly recommend. These resources offer in-depth information on water measurement and its impact on fishing.